
Quick answer
There is no universal percentage of a QR code you can safely cover. In our local test, a 7×7-module white cover at the upper-left finder pattern failed in all 24 cases, while the same-size center cover still decoded in 20. Preserve the corner patterns and clear border, then test the finished design in the conditions where people will use it.
Contents
- What we tested
- Equal covers produced different results
- Why error correction is not a logo budget
- Cropping the border exposed a decoder difference
- How to check a QR design before using it
- Inspect or repeat our test
A logo, a sticker or a damaged corner can hide part of a QR code. The obvious question is how much you can cover before it stops working. Our controlled test found that the location of the cover changed the answer dramatically, even when the covered area stayed the same.
We generated 240 QR images and checked them with two software decoders. With a white square covering 7×7 modules at the upper-left finder pattern, neither decoder recovered any of the 24 original URL payloads. Move that same-size square to the center, and both recovered 20 of 24.
Those counts describe our saved images and decoder versions. They aren't a safe logo-size allowance for every QR code or a prediction of how your phone will scan a printed design.
What we tested
We used three fictional URL payloads of different lengths, four error correction levels (L, M, Q and H), and two image scales: four or eight pixels per module. A module is one square in the QR grid. These combinations gave us 24 baseline symbols, each with a four-module white border, or quiet zone.
For each baseline, we saved ten versions: the untouched control; white square covers with sides of 3, 5, 7 and 9 modules at two locations; and a version with the quiet zone cropped away. The two cover locations were the upper-left finder pattern and the geometric center of the symbol. Versions were selected automatically by the encoder and ranged from 2 to 12; we did not test every intervening version.
We checked all 240 saved PNGs with ZXing-C++ 2.3.0 and OpenCV 4.11.0. A success required the decoded text to equal the complete original payload. Detecting a QR-shaped region alone did not count. We repeated the matrix, and the saved image bytes and result records matched between runs.
The URLs use the reserved example.invalid domain. We decoded their text locally without visiting a destination. This experiment measured symbol readability, not whether the destination was safe or available.
Equal covers produced different results
The table groups each operation across all 24 combinations. Every count is the number of exact payload recoveries out of 24 images.
| Variant | ZXing-C++ | OpenCV |
|---|---|---|
| Unchanged control | 24/24 | 24/24 |
| Finder cover 3×3 modules | 0/24 | 0/24 |
| Center cover 3×3 modules | 24/24 | 24/24 |
| Finder cover 5×5 modules | 0/24 | 0/24 |
| Center cover 5×5 modules | 22/24 | 22/24 |
| Finder cover 7×7 modules | 0/24 | 0/24 |
| Center cover 7×7 modules | 20/24 | 20/24 |
| Finder cover 9×9 modules | 0/24 | 0/24 |
| Center cover 9×9 modules | 18/24 | 18/24 |
| Quiet zone removed | 24/24 | 0/24 |
The placement difference was visible even with the smallest cover. A 3×3-module square at the upper-left finder location produced no successful recoveries in either decoder. The same-size center cover produced 24 of 24.
As the center cover grew, the number of successful recoveries declined: 24, 22, 20 and 18 out of 24 for sides of 3, 5, 7 and 9 modules. Both decoders returned the same totals for those operations. None of the four finder-cover sizes decoded in either implementation.
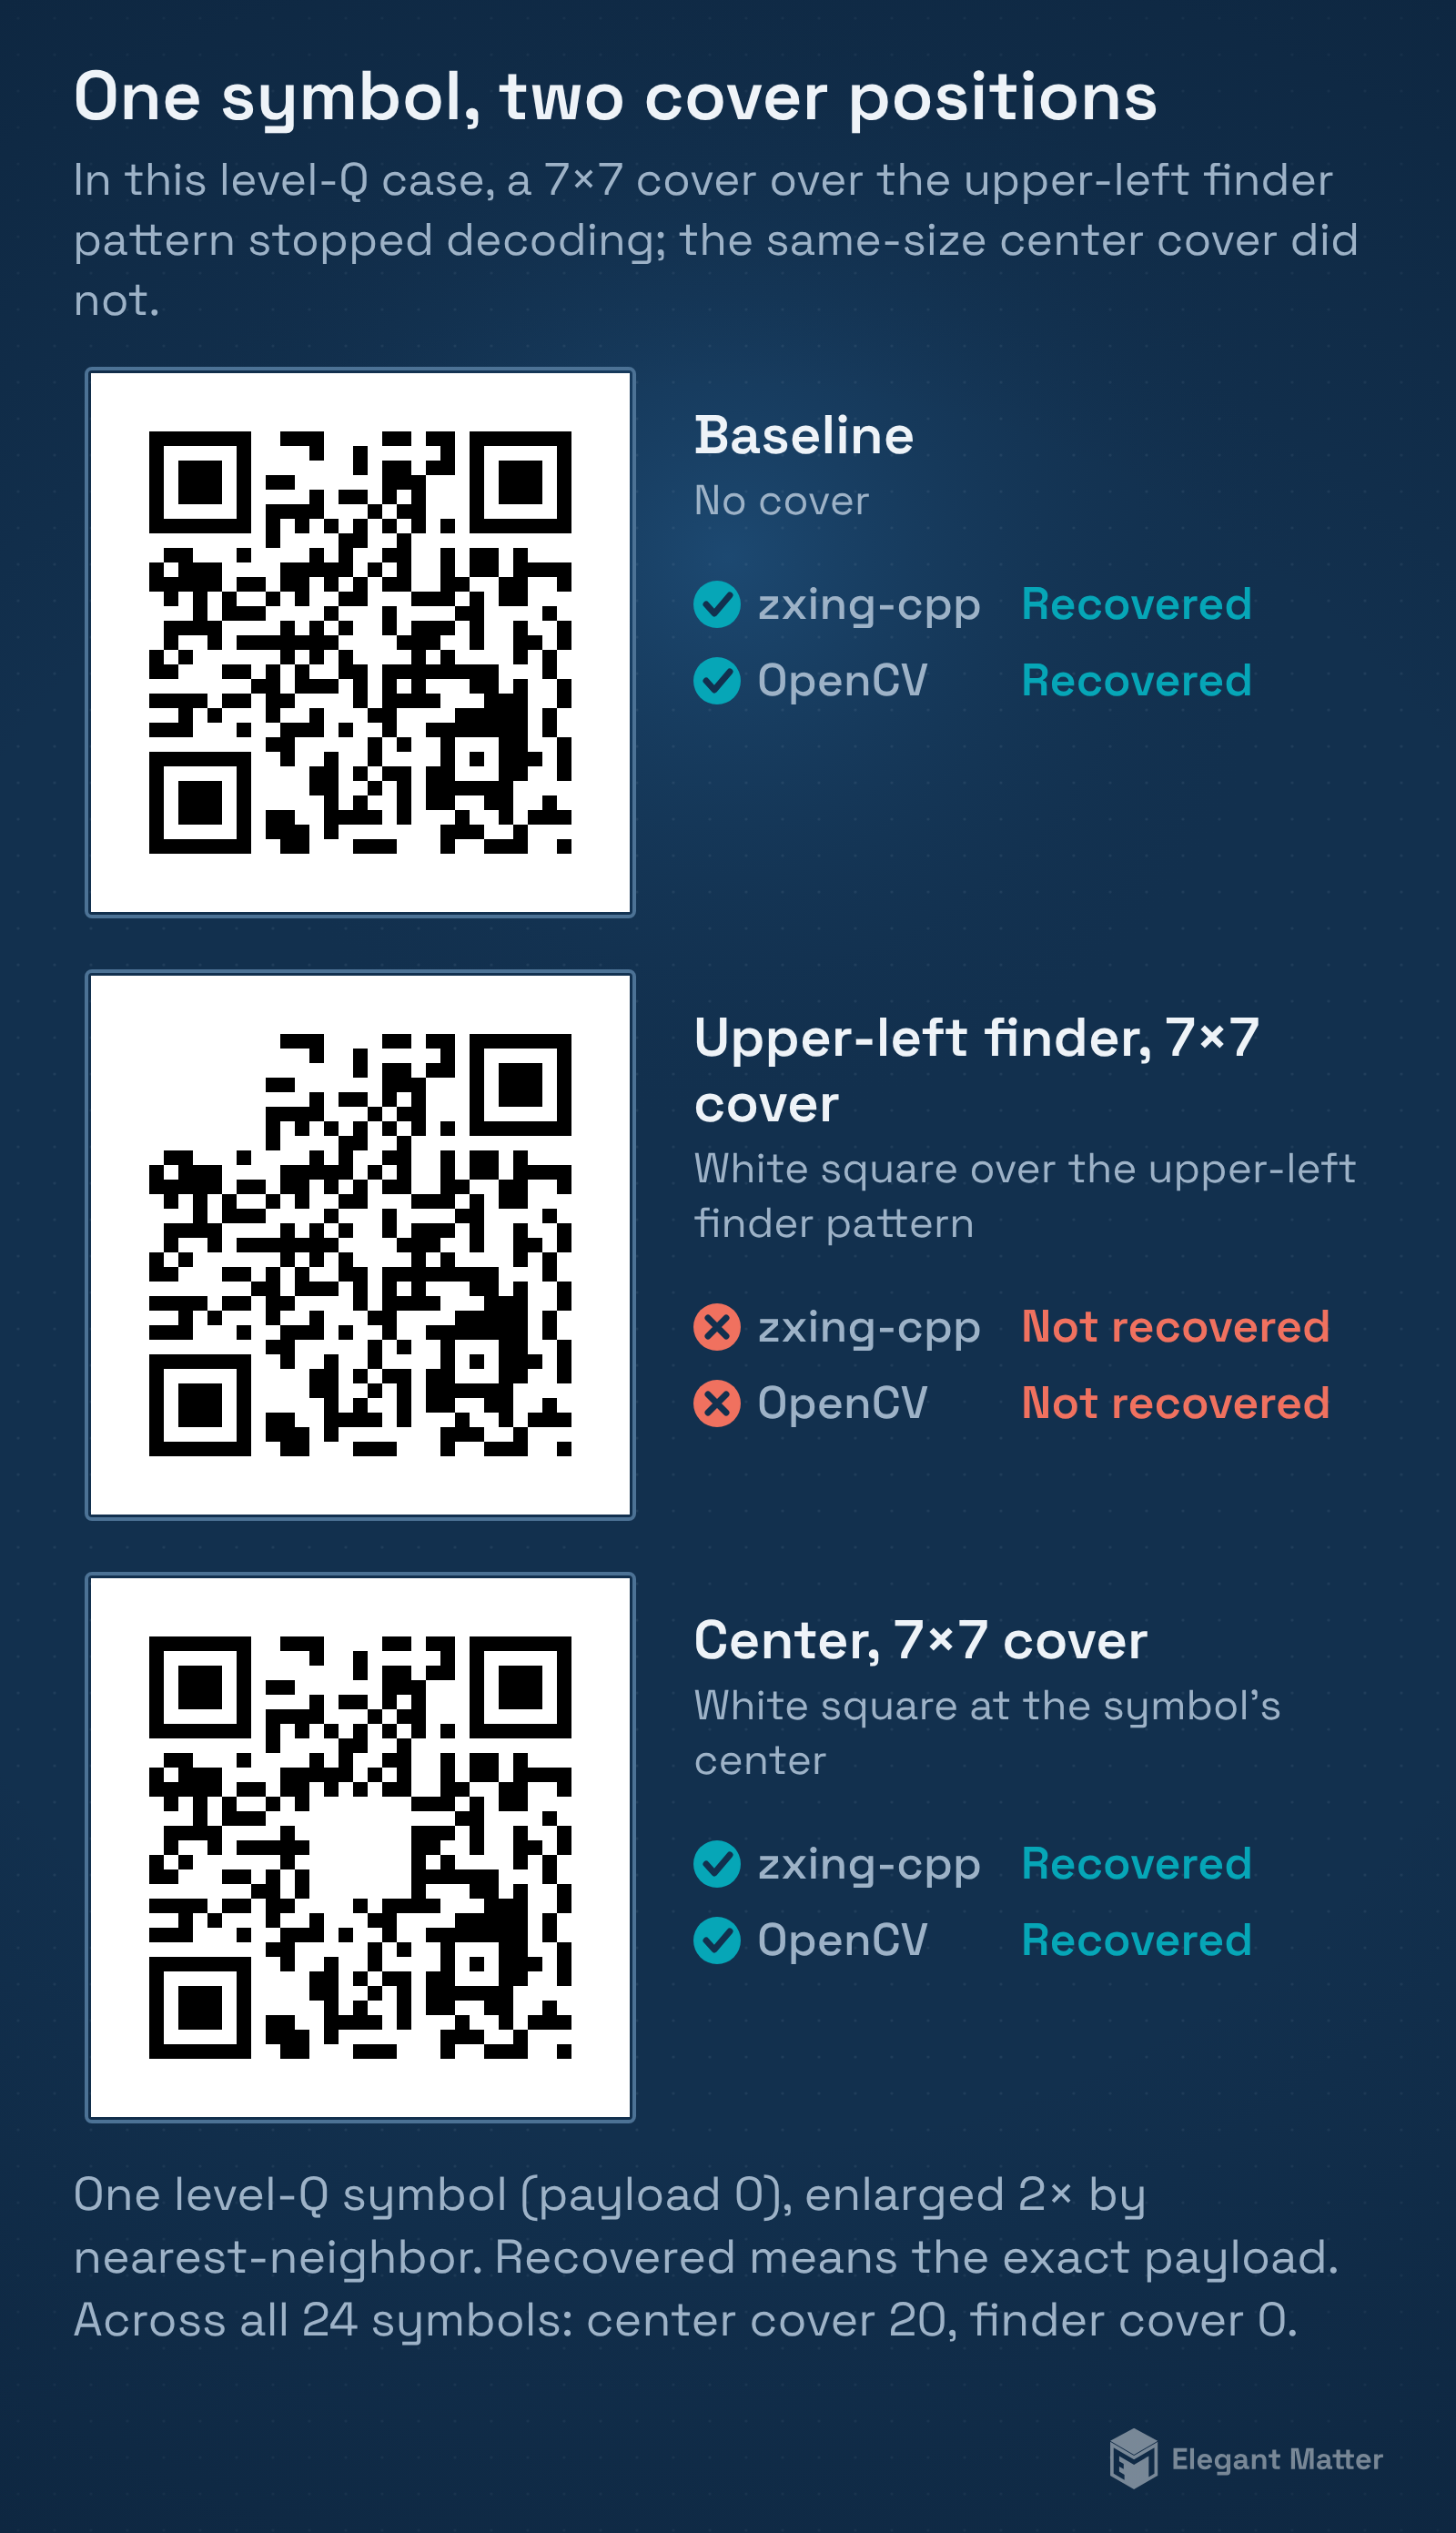
These are equal-sized white rectangles, not equal quantities of destroyed information. Some covered modules were already white. Symbols also had different dimensions and patterns. A 7×7 cover therefore occupied a different proportion of each symbol, and it changed a different number of black modules. The downloadable results record those distinctions.
A center cover can overlap functional patterns as well as encoded data. These results compare two cover locations; they do not establish a safe place for a logo.
Why error correction is not a logo budget
DENSO WAVE's explanation of QR error correction describes restoration capacity in terms of codewords, the units used to encode information. One codeword is eight bits. A percentage of recoverable codewords does not translate directly into the same percentage of the visible square being safe to cover.
A QR image contains structure that helps a decoder locate and interpret the symbol. Our finder-cover results show why it is risky to judge a design by the covered area alone: a small cover at that location prevented recovery even when we used level H.
Higher error correction did help some of our center-covered samples. With the largest center cover, 9×9 modules, both decoders recovered 2 of 6 level-L images, 4 of 6 level-M images and all 6 images at each of levels Q and H. That comparison includes automatically selected symbol versions, so it does not isolate error correction as the only variable. Raising the level can also change the symbol's size and layout.
For a design decision, use the error correction setting as one input. Keep functional patterns clear, preserve the border and check the actual exported code. The test provides no universal safe percentage for a logo, sticker or missing corner.
Cropping the border exposed a decoder difference
The quiet zone is the blank margin around the symbol. DENSO WAVE specifies four modules of clear space on every side for a standard QR code.
When we removed that border from our saved images, ZXing still recovered all 24 payloads. OpenCV recovered none. Both had decoded all 24 untouched baselines.
That result demonstrates tolerance in one particular decoder and failure in another under the same crop condition. It does not make the border optional. A design that works in a forgiving reader can fail elsewhere. Keep the quiet zone in the exported image and leave it clear when placing the code beside text, artwork or a background.
We cropped the images to the symbol boundary. We did not test every possible background, reduced border width or surrounding design, so the result cannot tell you the minimum margin each reader needs.
How to check a QR design before using it
If you control the design, start with the unmodified code and confirm that it returns the intended full destination. Then check the final version after adding a logo, resizing it or placing it in its surrounding artwork.
- Keep all three corner finder patterns clear. Our covers targeted only the upper-left one, so the measured failure counts apply specifically to that location.
- Preserve the four-module quiet zone. Avoid treating white space as disposable padding when cropping or laying out the image.
- Check the exact payload, including the path and parameters. A reader displaying a result is not enough if it returns the wrong destination.
- Try more than one reader. Our border test produced opposite outcomes in two implementations.
- Test the real delivery format. For a printed menu, poster or label, check the final print with the phones, distances and lighting that matter to its use.
The fifth step needs real-world testing. Our experiment used clean, axis-aligned PNGs passed directly to software decoders; it did not use a phone camera, printer or physical sticker. It also did not measure blur, glare, viewing angle, scanning speed or long-term wear.
If a code fails, compare it with the original export. Removing a decoration or restoring a cropped border gives you a concrete change to test. Randomly drawing missing squares into a damaged code can alter the data; if you own the destination, regenerating the code from the known URL is easier to verify.
Inspect or repeat our test
Our evidence package contains the 240 original PNGs, their symbol matrices, full payloads, per-image decoder results, covered and changed-module counts, hashes and a local verification script. The matrices let readers inspect the exact symbols instead of relying on a newly generated code with different layout choices.
The generation environment used Python 3.12.14, qrcode 8.2, Pillow 12.3.0, ZXing-C++ 2.3.0 and opencv-python-headless 4.11.0.86. We used automatic symbol versions, L/M/Q/H error correction, four-module borders and four- or eight-pixel modules. The method and files are dated 13 Oct 2026.
The sample is deliberately small and controlled: three fictional URLs, two raster scales, two cover locations and two decoder versions. It demonstrates how placement and reader tolerance affected these files. It cannot certify an arbitrary QR design or establish reliability across consumer devices.
For your next design, the useful question is whether its actual symbol and final presentation work in the readers you need. The same covered area can give very different answers depending on where it lands.
Download the study files and results (ZIP).
Original fixtures, scripts and study results are available under CC0 1.0; third-party software retains its own licenses.